Project Details
- What I did : EDA and visualization
- Tools Used : Tableau, Pandas, Jupyter
- Link : Tableau profile
- Code : Data processing
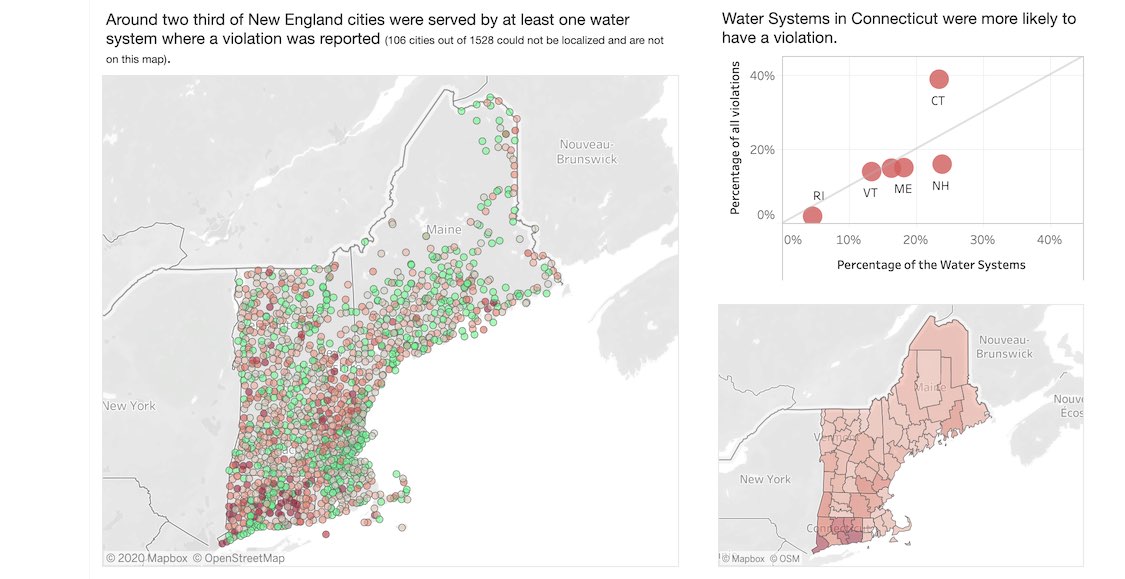
Drinking water quality violations in New England
In this personal project, I explored the drinking water quality violations in New England. The violations and some key findings are visualized in a static Tableau dashboard. The visualization is commented to provide context, explanations, and interpretations.
Initially, I conducted this data exploration in Python, intending to inform a predictive machine learning model. The model would have predicted drinking water quality violations, in general or due to the presence of pesticides. However, good predictors were lacking and I realized that such a model could not reach a satisfying accuracy.
Nevertheless, I also realized that the data by itself, without any modelling, was interesting and worth presenting in a dashboard. Indeed, these data are only accessible to the public in a tabular format, never presented visually for the whole New England, and especially not geolocalized. Thus, I uploaded the cleaned, transformed and geolocalized data in Tableau to construct the dashboard and communicate these data with the public.
Explore the visualization
The visualization is best explored in full screen mode (icon is on the bottom right), or in my Tableau Public profile. Use shift-click to navigate the maps.
Background
The US Environmental Protection Agency (EPA) sets standards for drinking water quality and is responsible for the implementation of the Safe Water Drinking Act (SWDA). Local agencies collect water samples and send them to the EPA in case of any violation. The EPA store this data in the Safe Drinking Water Information System (SDWIS).
Annually, numerous water systems detect contaminants above the Maximum Contaminant Level (MCL), for instance, 3 to 10% of the community water systems (c.f. Allaire 2018). The drinking water quality violations can be tragic for the served communities.
Data & Code
The data covers the years 2012 to 2017 and was extracted from SDWIS via a REST API as described in this Jupyter notebook. Data processing is done and explained in this Jupyter notebook.