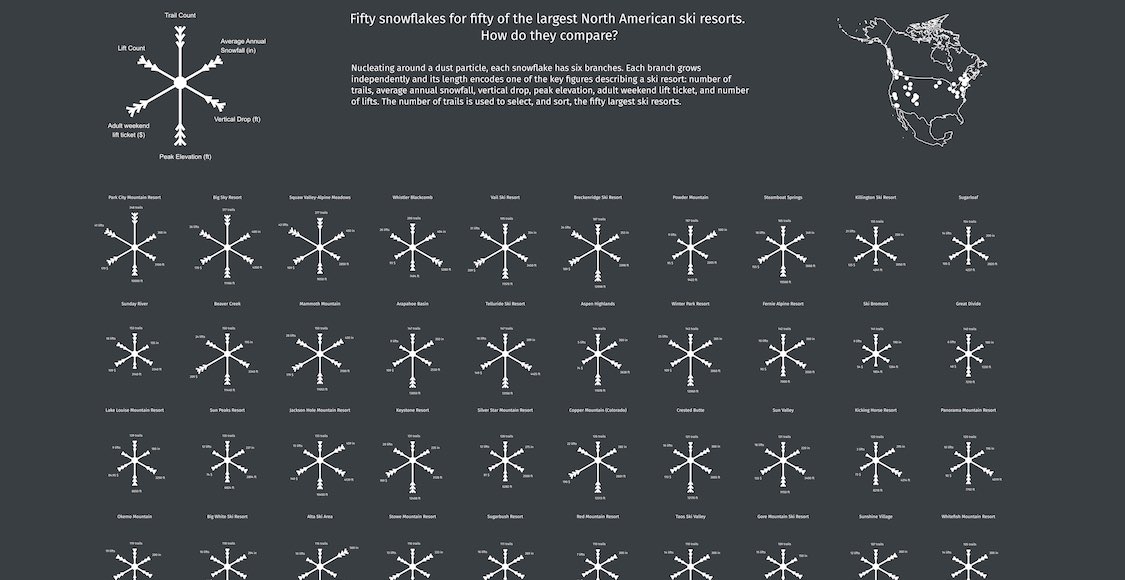
Fifty snowflakes for fifty of the largest North American ski resorts. How do they compare?
Nucleating around a dust particle, each snowflake has six branches. Each branch grows independently and its length encodes one of the key figures describing a ski resort: number of trails, average annual snowfall, vertical drop, peak elevation, adult weekend lift ticket, and number of lifts. The number of trails is used to select, and sort, the fifty largest ski resorts.
Design Process
Coming from a data analytics background, I wanted to try something different and fun and work on my design skills. I always loved small multiples, so I decided to create a poster. The raw data (source) was processed, transformed, and plotted in R; Inkscape was then used to combine the elements.
I quickly came to the idea of small multiples visualization in polar coordinates, and arrived at a first design:

Still a lot of work ahead! The color scale is not attractive, there are probably too many resorts, the distortion of the bars due to the use of polar coordinates is disturbing and misleading.
Nevertheless, it is from the vision of this first draft that the inspiration came: why not create a snowflake for each resort? How poetic!
I switched to black and white, limited the number of variables to 6, and the number of resorts to 50. After several iterations, I managed to draw the first snowflakes with ggplot2 using geom_segment().

Then, I proposed the design to the Data Visualization Society’s Slack “share-critique” channel to get feedback from more experienced designers. Thanks to their valuable comments, I arrived at my final design: a different normalization of the variables to better distinguish the smallest resorts and a different order of the variables, the most important ones at “noon” and then clockwise. Et voilà!

License: CC BY-SA 3.0.